Takeover Time
Takeover time is the number
of generations it takes for a single best individual in the initial population
to colonize the whole population with copies of itself under the effects of
selection only [GD91].
The takeover time is usually used as an approach to characterize the selection
pressure of an EA. Shorter takeover times mean a stronger selection.
As an exapmle, we plot in figures 1 and 2 the takeover times for some synchronous
(Fig.1) and asynchronous cEAs (Fig.2). For that, only the selection operator
is active (binary tournament). Nor mutation neither crossover are applied during
the evolution. Initially, only one optimal individual is placed in a random
location of the grid, and it is let being selected and copied until it takes
over all the grid positions. The axes of the graphics represent the proportion
of the best individual in the population (X axis), and the number of generations
or time steps (Y axis).
|
|
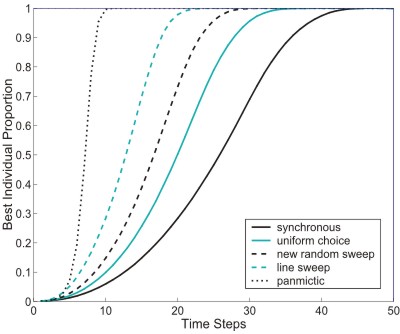
Figure 1.
Growth curves of the best individual for two cEAs with different neighborhood
and population shapes, but similar ratio values. The graph represents
the proportion of population consisting of best individual as a function
of time |
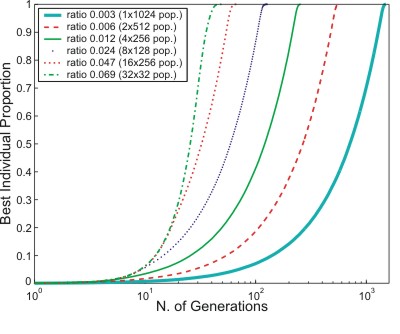
Figure 2. Takeover
times with tournament selection using a L5 neighborhood in populations
of 1024 individuals with different grid shapes. Mean values over 100 runs.
The graph represents the proportion of population consisting of best individual
as a function of time. Horizontal axis is in logarithmic scale |
Theoretically, only a little work has been made in the literature in this research
line in cEAs. The first approach for determining a model for the growth curve
(the proportion of the best individual in the population along the time in a
cEA) was proposed by Sarma
and De Jong (1997). In that work, they proposed a simple quantitative
model for cellular EAs based in the logistic family of curves already known
to work for panmictic EAs [GD91].
In summary, the proposed equation is:
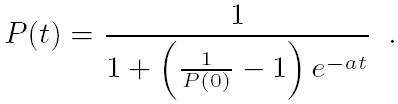
where a is a growth coefficient and P(t) is
the proportion of the best individual in the population at time step t.
This model threw accurate results for synchronous updates of square shaped cellular
EAs.
As it can be guessed from Figures 1 and 2, it is difficult (maybe
not possible) to adjust the takeover of algorithms using populations with non-square
ratios and/or asynchronous policies with a low error. In the case of asynchronous
cEAs, improved models have been proposed by Alba, Giacobini and Tomassini not
following a logistic curve. In [GTT03]
the authors present quantitative models for the takeover time in cellular evolutionary
algorithms structured as a ring with nearest neighbor interactions only. These
models are based on simple difference probabilistic equations, and the gap between
the real behavior of the algorithm and the model is large in some cases. In
a latter studies [GAT03]
[GATT04], Alba,
Giacobini, Tettamanzi and Tomassini extended those models to synchronous and
asynchronous cEAs using a 2-D (square) population.