The results representation way for RND2 differs from the predecessor. This occurs because in RND the typical side of the grid used was 64, and now it is 287, and showing the results in an intuitive way on a 287x287 matrix by screen, is very difficult. So, we put the output grid solution into a directory named directorio_mapas in a text file called terrenoX.txt, where X is a number that depends on the number of files created. Also, we have added another information to the output screen, next to the number of used transmitters, covered area, uncovered area and the best fitness. Now, we can see the final configuration of the chromosome and the percentage of the covered area.
We have developed besides a new independent class denominated geografico.java. Once finished the main program execution, we can run geografico, this is the syntax:
> java geografico <output_solution_file> <jpeg_file_name>
where:
output_solution_file: it is the output text file name.
jpeg_file_name: this is the name of the new jpeg image that is going to be created from the text file.
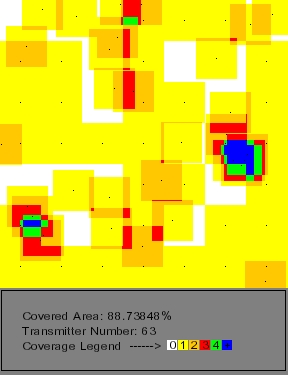
This new class will carry out two tasks: a graphic representation of the grid, where we will be able to see in a very intuitive way the final state of the problem, and it will create a JPEG file where it will keep this representation.